Here is the corrected text with spelling, grammar, and punctuation errors addressed:
Do you really need more technicians (if you can find them), or can you increase the labor sales value of the technicians currently employed?
One way to determine your staffing requirements is to use a mathematical equation. The first step is to calculate what the labor sales requirement is to retain the desired net profit.
Expenses divided by the gross profit % = labor sales to break even. An actual case study had these results:
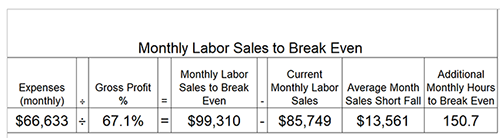
In this case, the current expenses and gross profit % require $99,310 in labor sales to break even. Current average month labor sales are $85,749, leaving a shortfall of $13,561. Based on the current effective labor rate of $90.00, an additional 150.7 hours are needed to break even. Achieving the desired net profit of 10%, 15%, and 20% requires the following labor sales and hours sold:
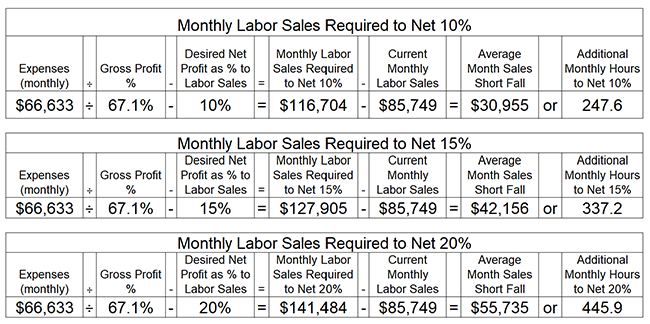
Expenses divided by the (gross profit % – desired net profit %) = labor sales required to achieve the desired net profit to labor sales.
Next, let’s look at the controllables that are used to calculate the current labor sales value of your technicians:
- Clock hours worked per day.
- Working days in a month.
- Productivity % – flat rate hours divided by clock hours worked.
- Effective labor rate – overall collection rate for work performed.
- Calendar Utilization % – how many days were worked compared to available days.
For example:
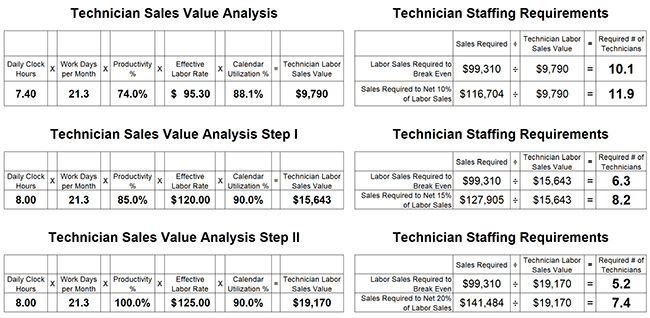
In the above example, the current technician staffing is 8 technicians with a labor sales value of $9,790, which requires 2 more technicians just to break even and 2 more to achieve a 10% net to sales. Without increasing the technician labor sales value, 4 more technicians need to be hired.
Conversely, increasing the labor sales value from $9,790 to $19,170, or 20% net, can be achieved without adding more technicians. Easier said than done! Some would say, and they would be correct. Some ways to improve these controllables are listed below.
In the above example, 4 of 5 controllables were increased to achieve the labor sales value:
Daily Clock Hours
Take the total clock hours worked for the entire staff and divide them by the number of days worked to determine the average clock hours worked per day. We assume that our technicians work at least 8 hours per day; however, in this case, they were averaging 7.4 hours per day. Most times, just making all aware of the importance of working a full 8 hours will improve that number.
Legitimate reasons for not working a full day may be identified, and action taken to correct this would be in order. Examples of why technicians do not work a full day could include:
- Dispatch timing – takes too long to get the first job.
- Scheduling – Running out of work in the afternoon.
- Accountability – more discipline concerning hours of work.
Working Days in a Month:
This controllable is somewhat “static,” meaning unless you are going to change how many days a week your technicians work and/or how many technicians are going to work extended days, you probably won’t improve this number.
Productivity Percentage:
One of 2 controllables that need to be managed daily. Flat rate hours divided by clock hours is the calculation for this controllable. For example, if technician “A” works 8 hours and produces 6 hours of labor, then he would be 75% productive. Technician “B” produces 10 labor hours and works 8; 125% would be his percentage. Improving technicians at the upper end of the scale would be minimal in most cases as they are already producing at a high level. On the other hand, technicians producing at the lower end are usually where increases in overall productivity come from.
Establishing and managing production objectives is an effective method to increase productivity. One method to determine objectives is the 5%, 10%, and 15% increments depending on each technician’s historic daily average. Logically, if you apply 5% to the top 1/3rd, 10% to the middle 1/3rd, and 15% to the lower 1/3rd, you would have a 10% increase in overall production when technicians meet or exceed their objectives.
The final objective needs to be a number that the technician has committed to achieving. It may be more or less than the calculated number based on circumstances, and adjustments can be made.
Other factors affecting technician productivity:
- Repair order count.
- Work mix.
- Advisor sales performance.
- Parts availability.
- Organizational structure – dispatch process.
Effective Labor Rate:
Several pay types are included in the overall ELR. Customer pay, Warranty, and Internal are typical labor types. When considering increasing the overall ELR, Customer pay is the first type to look for lost opportunities.
Most times increase in CP ELR can be achieved just by adhering to the current pricing policy. For example, if the department has a pricing policy for customer pay to have menu pricing for maintenance operations and job pricing for repair operations. A review of repair operations and the rates charged can reveal how well the policy is adhered to. If labor charges are inconsistent for the same operation, then a further look would be warranted.
Work mix can also have an impact on the CP ELR. If 80% of work performed is maintenance at competitive rates, the remaining contribution from repair work at 20% will not move the needle as far.
A 60/40 maintenance and repair work mix is a good target to shoot for to achieve a balanced contribution to the rate.
Improving menu sales and ASR (Additional sale requests) closing ratios are also items to consider.
Calendar Utilization:
This measurement of attendance is as impactful as productivity. The amount of days the technicians are present vs. the available days is a number to look into. We know the technicians will have planned days off and will not be here 100% of the time. For that reason, the typical range for calendar utilization is between 88% and 92%. The tenure of the staff (vacation), paid time off, training, and illness can all be factored into attendance. Knowing where the department is currently and if there are opportunities to improve is next.
To summarize, any improvement in any controllable will increase your technician’s labor sales value and the required technician count. An improvement in all will allow us to achieve higher levels of profitability and NPS (Net Promotor Scores) as the department can serve more customers more expediently with increased productivity.
So you can get in line with the rest of the service managers looking for more technicians or take a look at your current situation and look for ways to improve.